
In this article, you will learn how to make a pie chart in Google Sheets. Let’s do it.
Table of Contents
YouTube Video: How to Make a Pie Chart in Google Sheets
To make it very convenient for you we have made a YouTube video on how to make a Pie Chart in Google Sheets. Please click the above link, have a look, and be sure to subscribe.
How to Make a Pie Chart in Google Sheets
Creating a pie chart in Google Sheets is a simple process. Here are the steps:
1- Open your Google Sheets document: Go to Google Sheets and open the spreadsheet where you want to create the pie chart.
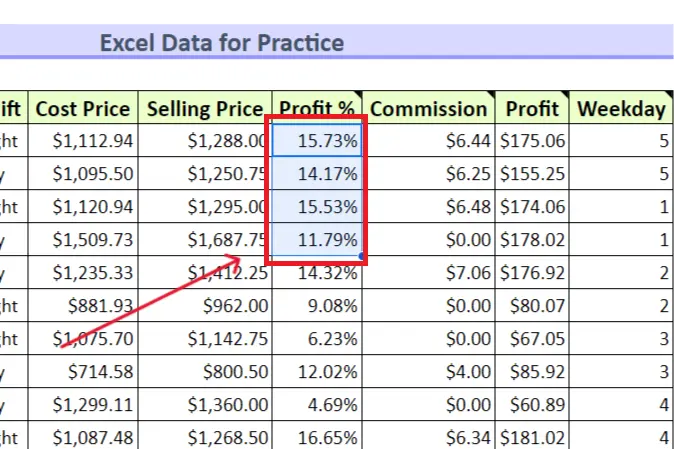
2- Enter your data: Make sure you have a set of data to graph. Typically, you’ll have two columns: one for the categories and one for the corresponding values.
3- Select the data you want to include in the pie chart: Click and drag to select the range of cells that contain your data.
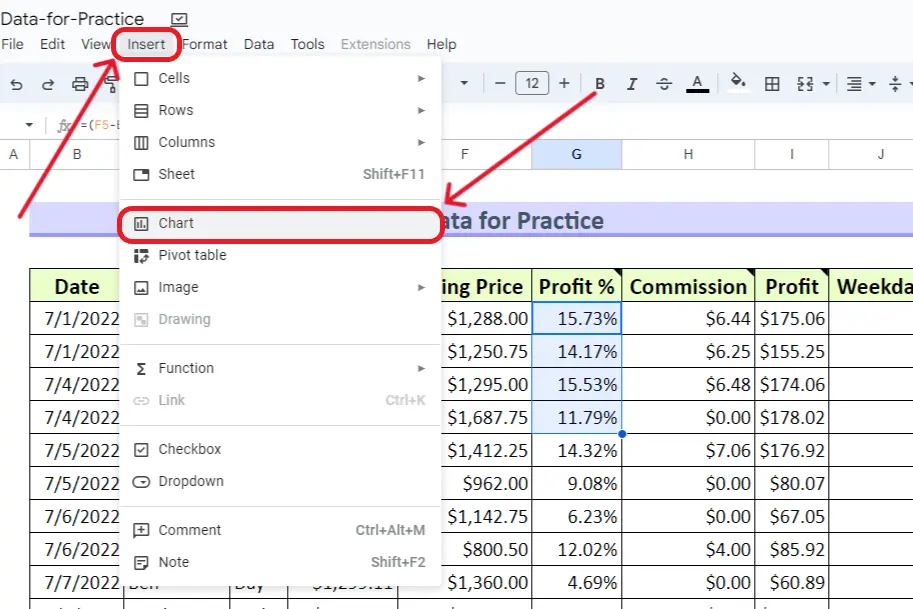
4- Insert the chart: Click on the “Insert” menu at the top of the screen. Choose “Chart” from the dropdown menu.
5- Configure the chart: In the Chart editor on the right-hand side: Choose the “Chart type” as “Pie chart.”
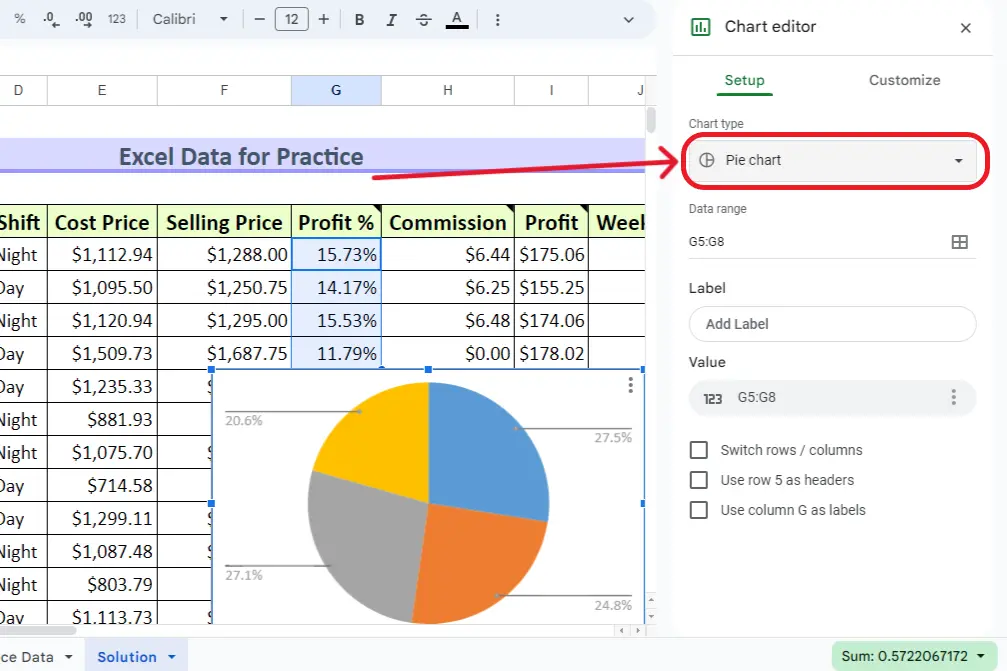
Adjust any other settings as needed, such as selecting data ranges for value and labels. You can select labels for each type of value. Simply click on the add label. You can follow the visual guide below.
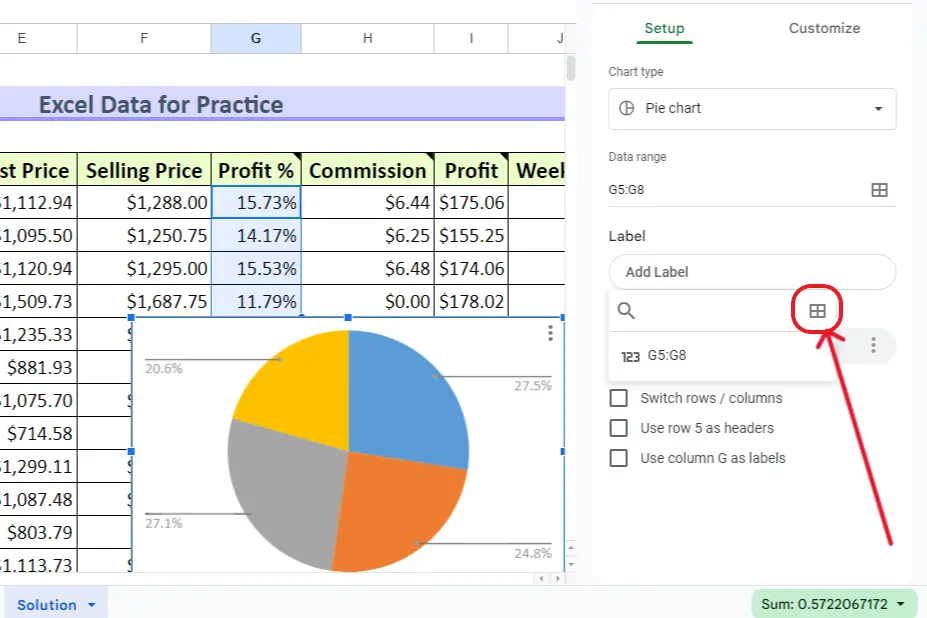
Then select the range that is to be used as labels for the relevant values. Now, hit OK.
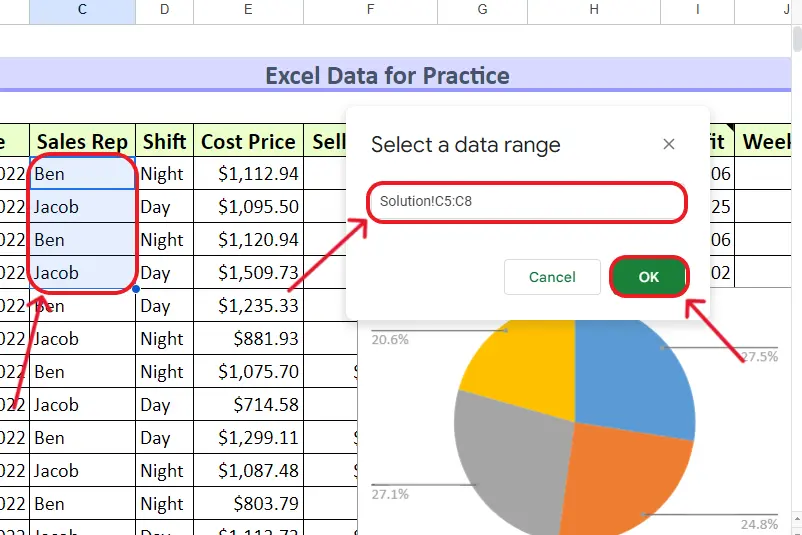
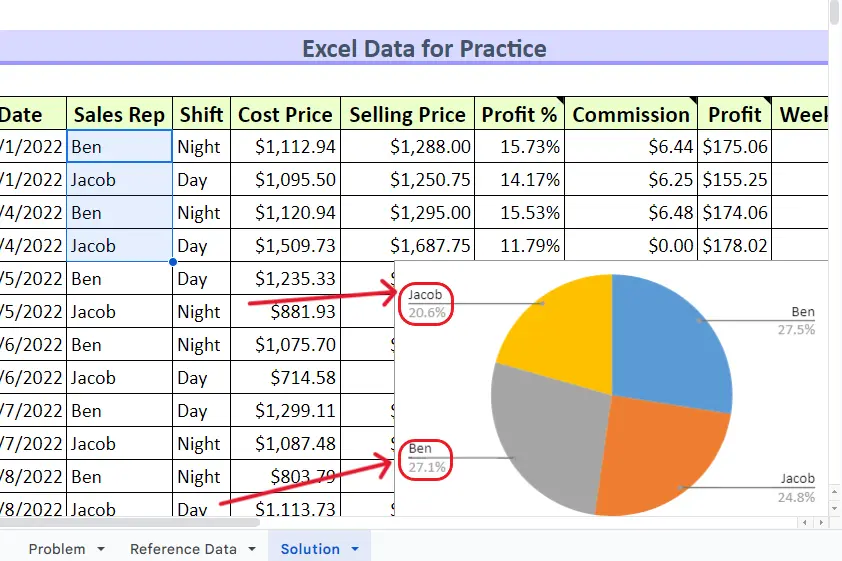
You can see the labels appear with the relevant values.
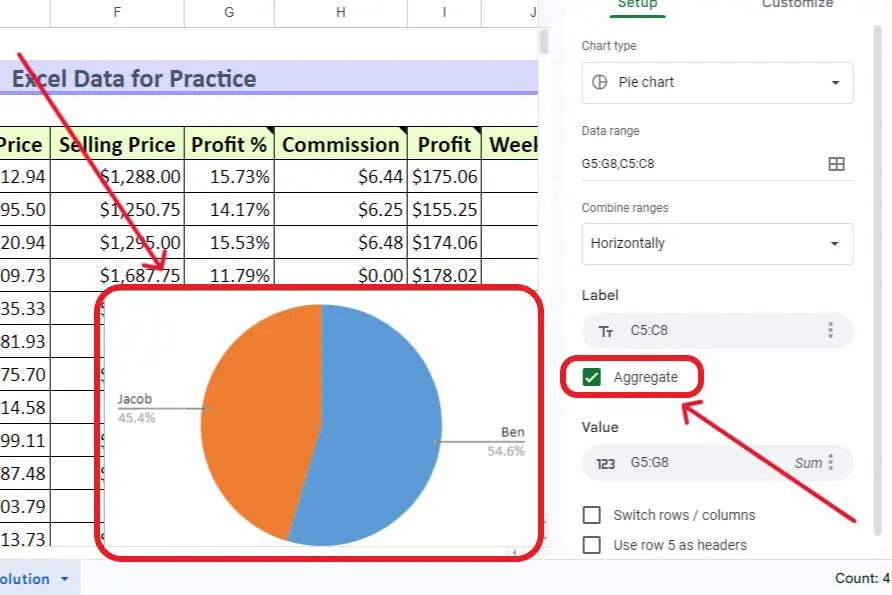
If the data appears more than one time for any label, you can use aggregate for showing collective data in a single pie.
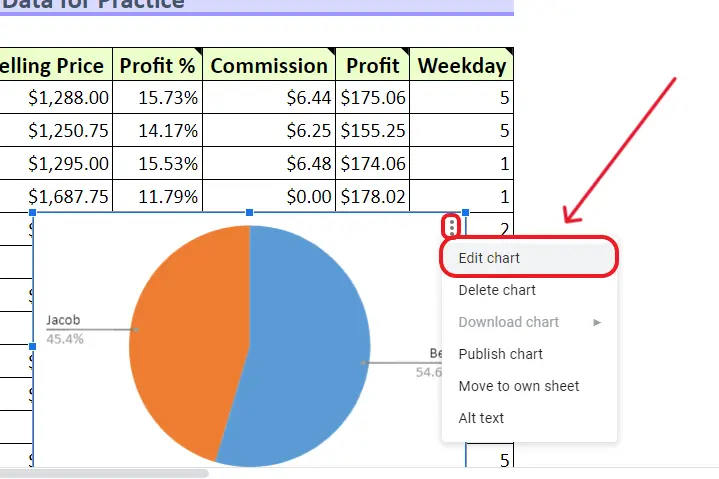
6- Customize the chart further (optional): You can customize the appearance of the chart by clicking on the chart itself and using the three dots that appear in the upper right corner of the chart to access the chart menu. From there, you can choose “edit chart” and then select “customize” to modify various settings.
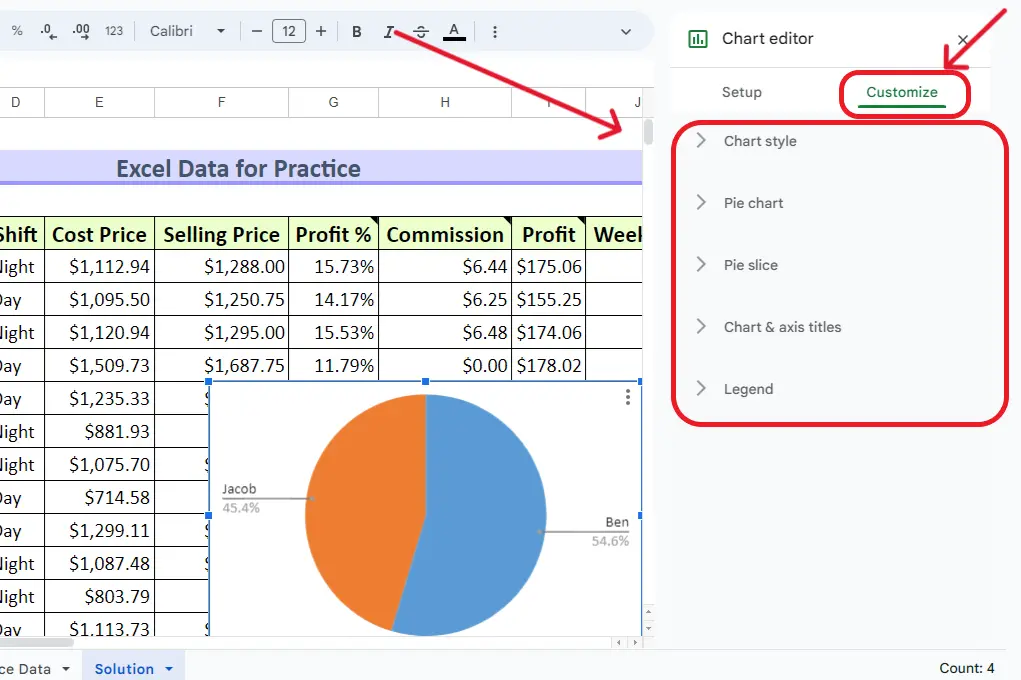
7- Close the Chart editor: Now you might have successfully learned how to make a pie chart in Google Sheets. Once you’re satisfied with the chart configuration, click the “X” in the top-right corner of the Chart editor to close it.
Your pie chart should now be visible in your Google Sheets document. If you make changes to the data, the chart will automatically update to reflect those changes. Ensure that your data is structured properly with one column for categories and another for corresponding values for the pie chart to work accurately.
Related: Have a look at the alternate guide from the official Google help forum How to make a Pie Chart in Google Sheets.
Conclusion
In conclusion, crafting a visually compelling pie chart in Google Sheets is a straightforward process, and this article has guided you through the step-by-step procedure. The YouTube video, “How to Make a Pie Chart in Google Sheets,” promises to provide a visual aid for an even more immersive learning experience. Don’t forget to subscribe YouTube Channel to get
By ensuring your data is well-organized with distinct columns for categories and corresponding values, you set the foundation for an accurate representation. The flexibility to customize your chart further allows you to tailor its appearance to your specific preferences. Don’t forget the handy tip to aggregate data for labels that appear more than once, creating a consolidated view in your pie chart.
As you experiment with chart configurations, remember that any changes to the underlying data will be seamlessly reflected in the chart. Master the art of pie chart creation in Google Sheets, and empower your data presentations with clarity and visual appeal. Stay tuned for the enlightening YouTube video tutorials!
Related: HOW TO FREEZE A ROW IN GOOGLE SHEETS
Related: HOW TO MAKE A GRAPH IN GOOGLE SHEETS
Related: HOW TO HIGHLIGHT DUPLICATES IN GOOGLE SHEETS
Related: You can also have a look at guide from another website on How to make a Pie Chart in Google Sheets.

I enjoy your website, obviously, but you should check the spelling on a number of your posts. A number of them have numerous spelling errors, which makes it difficult for me to tell the truth, but I will definitely return.
Thanks for your suggestion.
I was more than happy to search out this net-site.I wished to thanks on your time for this wonderful learn!! I undoubtedly having fun with every little bit of it and I have you bookmarked to take a look at new stuff you weblog post.