In this article, you will learn how to make a line graph in Google Sheets. Let’s do it.
Table of Contents
YouTube Video: How to Make a Line Graph in Google Sheets
Coming Soon!
How to Make a Line Graph in Google Sheets
To create a line graph in Google Sheets, you can follow these steps:
1- Open you Google Sheets Document: Go to Google Sheets and open the spreadsheet where you want to create the line graph.
Related: How To Search In Google Sheets
2- Enter your data: Make sure you have a set of data to graph. Typically, you’ll have two columns: one for the X-axis (horizontal) and one for the Y-axis (vertical).
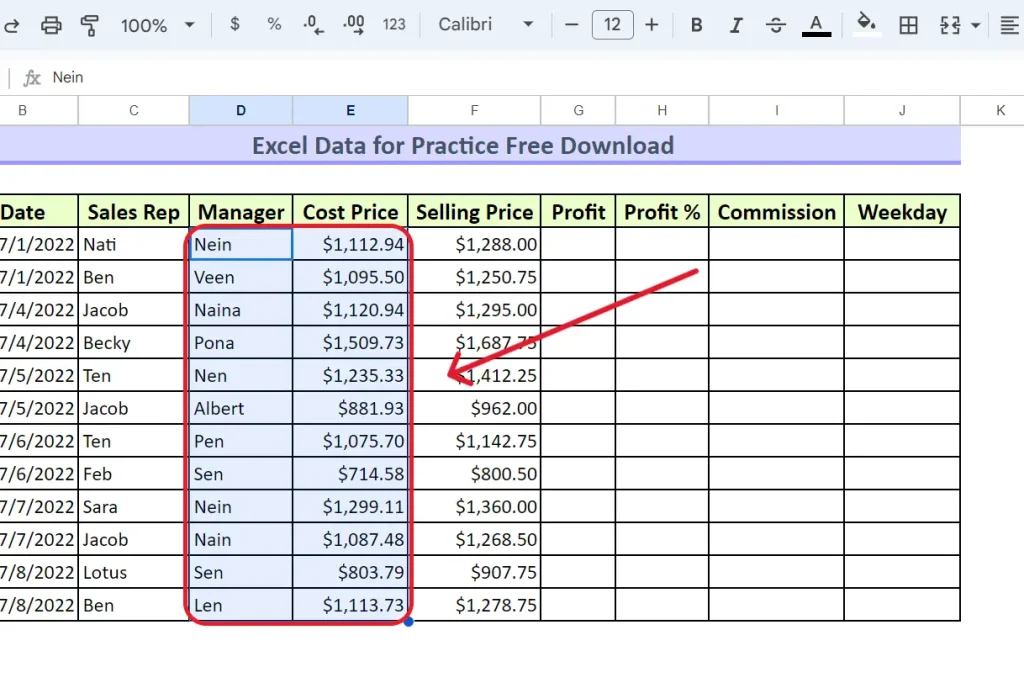
3- Select the data you want to include in the graph: Click and drag to select the range of cells that contain your data.
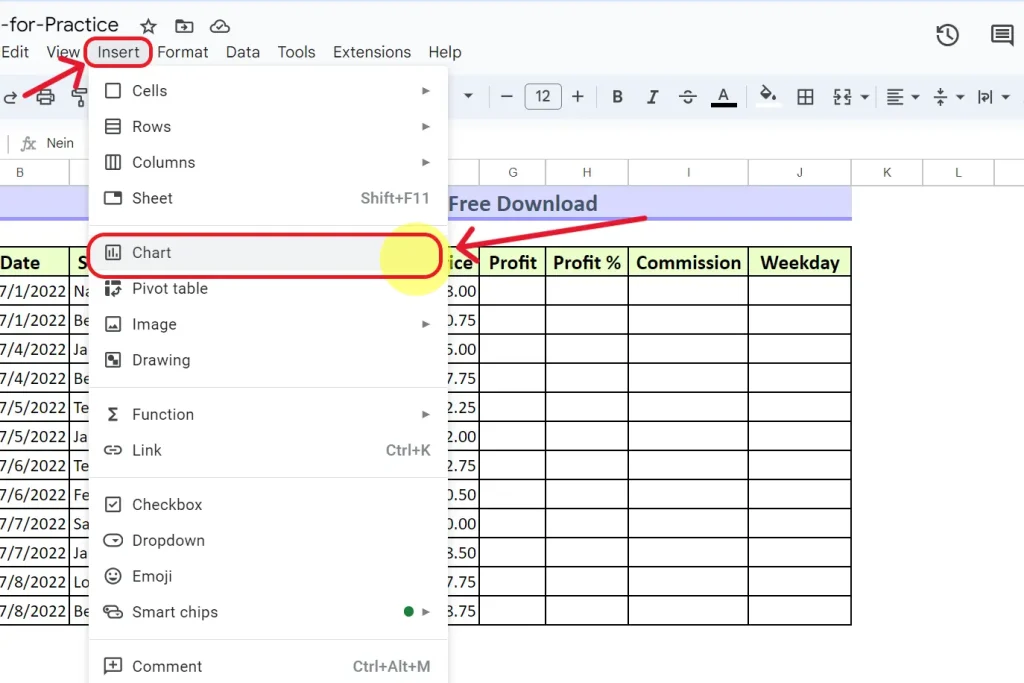
4- Insert the chart: Click on the “Insert” menu at the top of the screen. Choose “Chart” from the dropdown menu.
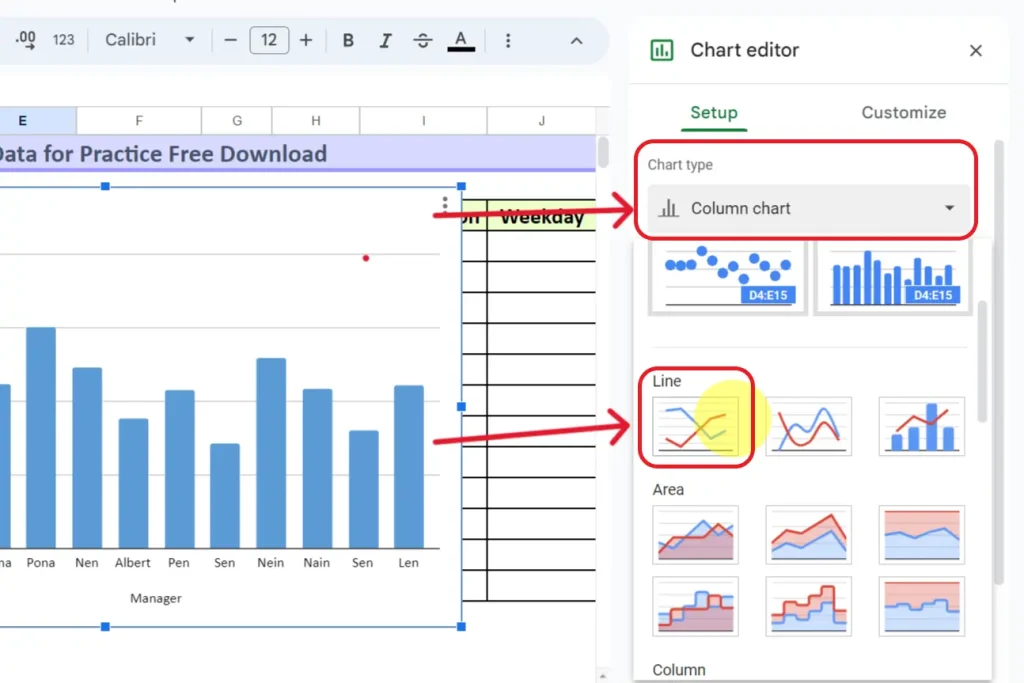
5- Configure the chart: In the Chart editor on the right-hand side, Choose the “Chart type” as “Line chart.”Adjust any other settings as needed, such as the title, axis labels, and legend.
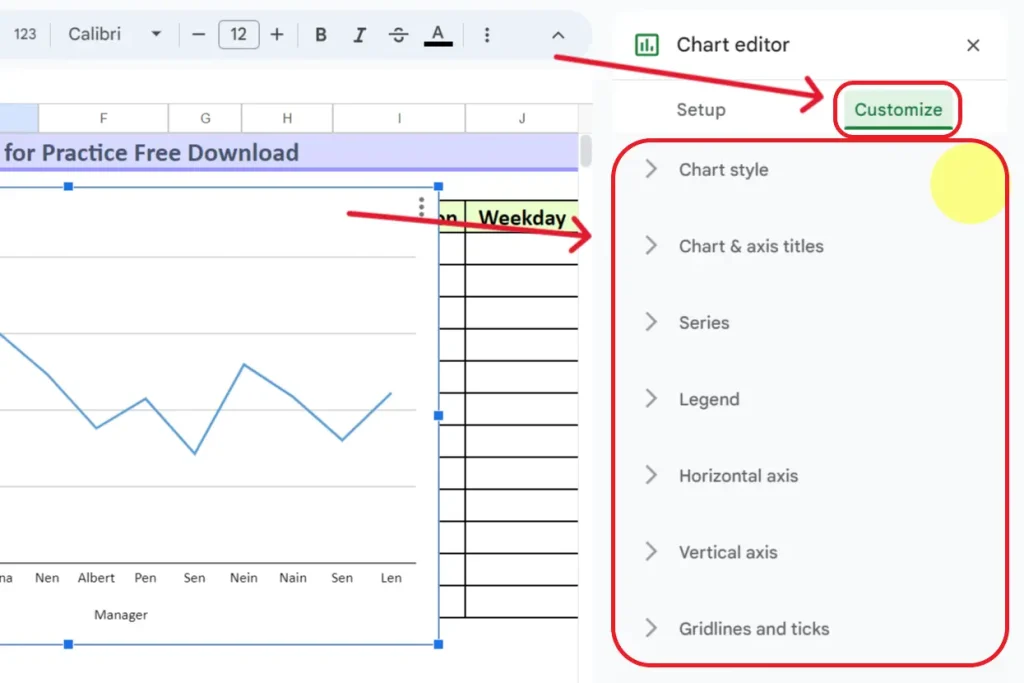
6- Customize the chart further (optional): You can customize the appearance of the chart by clicking on the chart itself and using the three dots that appear in the upper right corner of the chart to access the chart menu. From there, you can choose “Edit Chart” to modify various settings in the customize section.
7- Close the Chart editor: Once you’re satisfied with the chart configuration, click the “X” in the top-right corner of the Chart editor to close it. Your line graph should now be visible in your Google Sheets document. If you make changes to the data, the graph will automatically update to reflect those changes.
Related: How To Make A Table In Google Sheets
Conclusion
In conclusion, creating a line graph in Google Sheets is a straightforward process that can greatly enhance your ability to visualize and analyze data. By following the step-by-step guide provided in this article, you can effortlessly transform your spreadsheet data into a dynamic and informative line chart.
Whether you are tracking trends, illustrating patterns, or presenting numerical insights, mastering the art of making line graphs in Google Sheets is an invaluable skill. Stay tuned for our video tutorial, “How to Make a Line Graph in Google Sheets,” for a more interactive and visual guide.
Don’t forget to explore other related content to boost your proficiency in spreadsheet functionalities. Start charting your data with precision and clarity today, and elevate your Google Sheets experience!
Related: Have a look at the alternate guide from the official Google help forum How to Make a Line Graph in Google Sheets.
Related: You can also have a look at guide from another website on How to Make a Line Graph in Google Sheets.
Related: How To Sort By Date In Google Sheets
Frequently Asked Questions: How to Make a Line Graph in Google Sheets
How do you make an XY graph in Google Sheets?
- Launch your Google Sheets document and locate the dataset for your XY graph, ensuring you have two columns representing the X and Y-axis values.
- Click and drag to highlight the range of cells containing your X and Y-axis data points.
- Navigate to the “Insert” menu at the top, choose “Chart” from the dropdown menu.
- In the Chart editor, opt for “Scatter chart” as the chart type, creating an XY graph.
- Fine-tune the chart appearance in the editor, adjusting labels or titles if necessary. Close the Chart editor, and your XY graph will now be visible in your Google Sheets document.
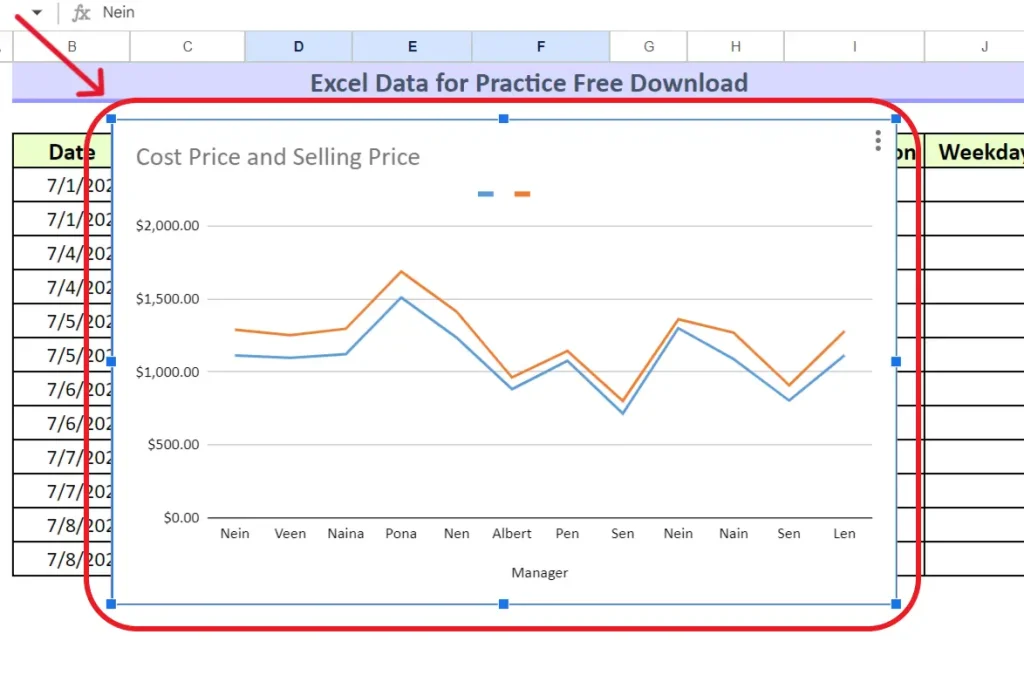
How to make a line graph in Google Sheets with two sets of data?
1. Organize Data: Arrange two sets of data in adjacent columns in your Google Sheets document.
2. Select Data Range: Highlight both data sets by clicking and dragging the corresponding cells.
3. Insert Chart: Navigate to the “Insert” menu, select “Chart,” and choose “Line chart” in the chart type.
4. Customize and Close: Adjust settings in the Chart editor if needed, then close it to display your line graph with two sets of data.
How do I make a line graph in Google Sheets with multiple sheets?
1. Organize Data: Arrange data on multiple sheets in Google Sheets.
2. Create Summary Sheet: Make a new sheet to consolidate data using formulas like `=Sheet1!A1`.
3. Select Consolidated Data: Highlight the range of cells on the summary sheet.
4. Insert Chart: Navigate to “Insert,” select “Chart,” configure as a “Line chart,” and close the editor to view your graph with data from multiple sheets.
How to make a line graph in google sheets with one line?
Creating a line graph in Google Sheets with one line is a straightforward process. Here’s a brief guide in four lines:
1. Open Google Sheets: Launch your Google Sheets document and ensure your data is organized with one column for the X-axis (horizontal) and one for the Y-axis (vertical).
2. Select Data Range: Highlight the range of cells containing your single set of data.
3. Insert Chart: Go to the “Insert” menu, choose “Chart,” and select “Line chart.”
4. Customize and Close: Adjust any settings if needed in the Chart editor, then close it. Your line graph with one line is now visible in your Google Sheets document.
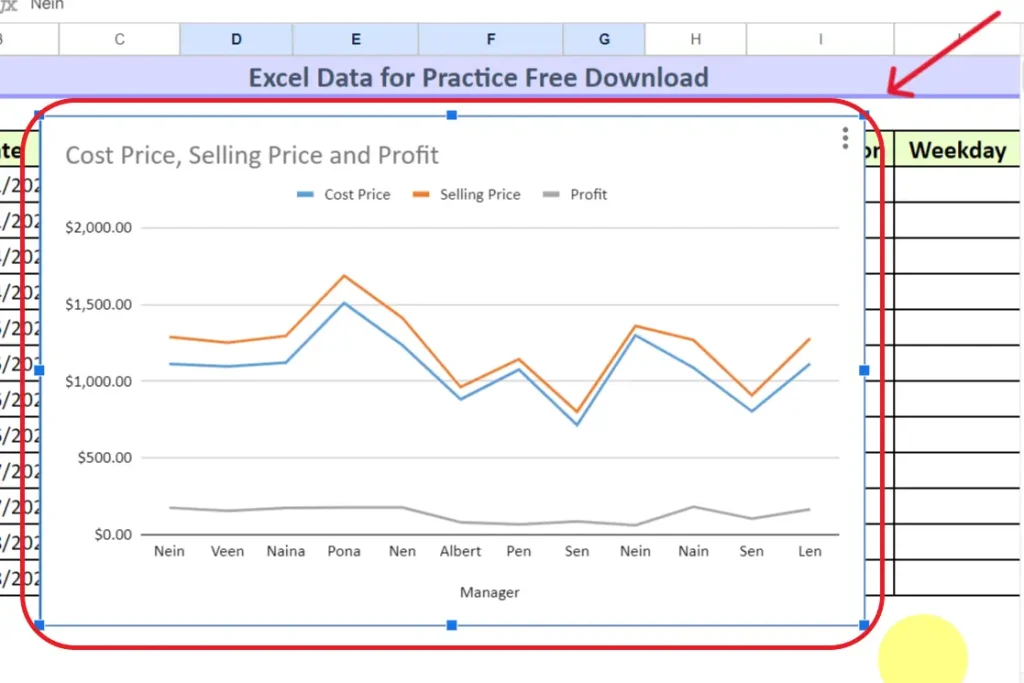
How to make a line graph in Google Sheets with three Sets of data?
1. Organize Data: Place three sets of data in adjacent columns in Google Sheets.
2. Select Data Range: Highlight all three sets of data cells to be included in the line graph.
3. Insert Chart: Access the “Insert” menu, choose “Chart,” and opt for “Line chart.”
4. Customize and Close: Fine-tune chart settings in the editor if desired, then close it to display the line graph with three sets of data.



1 thought on “How to Make a Line Graph in Google Sheets – Best Guide 2024 (Updated)”